Since this page is automatically translated by the machine, it may be less accurate than human being's work.
Haenam-gun, Jeollanam-do_Housing Supply Rate Status
This is the housing supply rate status data for Haenam-gun, Jeollanam-do. This data consists of 9 types: year, number of households, total, single-family homes, multi-family homes, apartments, townhouses, multi-family homes, and supply rate. It shows the numerical changes in the number of households and residential homes over 14 years from 2009 to 2022. - The number of single-family homes, multi-family homes, apartments, and townhouses has steadily increased. - Multi-family homes have increased until 2017 and then decreased. - The supply rate has gradually increased and is maintained at over 110% as of 2018. - Vacant houses, which are one of the biggest problems in rural areas, are included in the figures.
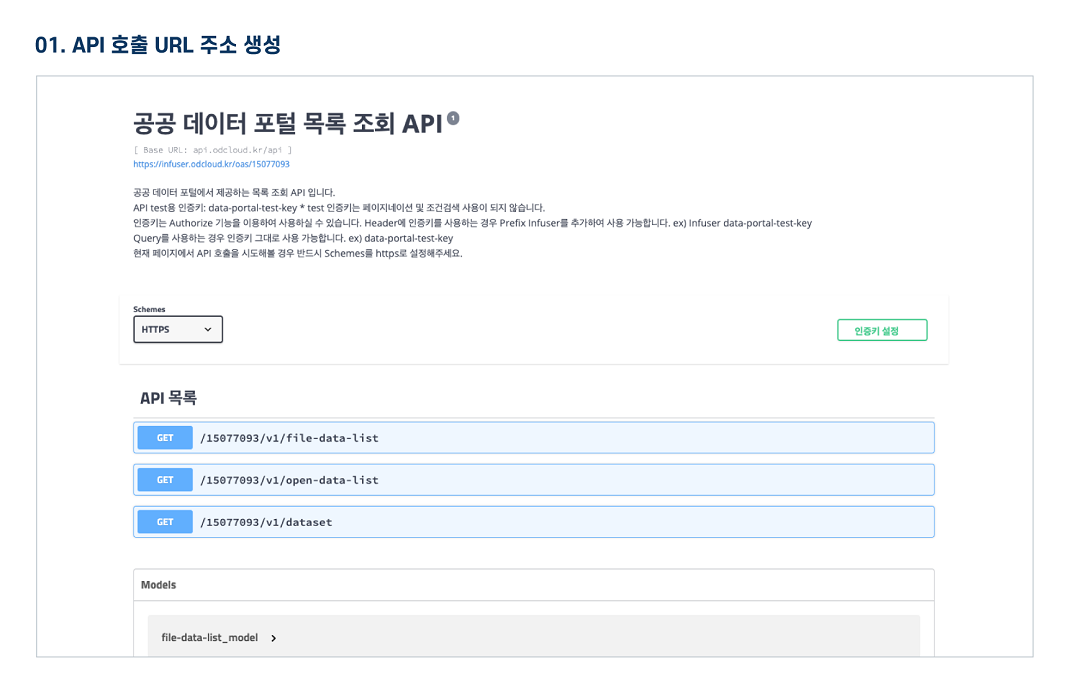
The Public Data Utilization Support Center automatically converts and provides open-format file data of three or more steps open to public data portals into open APIs (RestAPI-based JSON/XML).
To use the open API, you need to sign up for a public data portal membership and apply for utilization. For inquiries about utilization, please contact the Public Data Utilization Support Center.
File data can be used by downloading without logging in.
To use the open API, you need to sign up for a public data portal membership and apply for utilization. For inquiries about utilization, please contact the Public Data Utilization Support Center.
File data can be used by downloading without logging in.
Haenam-gun, Jeollanam-do_Housing Supply Rate Status
File data information Download metadata Provides schema.org based metadata.
The Public Data Utilization Support Center automatically converts and provides open-format file data of three or more steps open to public data portals into open APIs (RestAPI-based JSON/XML).
To use the open API, you need to sign up for a public data portal membership and apply for utilization. For inquiries about utilization, please contact the Public Data Utilization Support Center.
File data can be used by downloading without logging in.
To use the open API, you need to sign up for a public data portal membership and apply for utilization. For inquiries about utilization, please contact the Public Data Utilization Support Center.
File data can be used by downloading without logging in.
Haenam-gun, Jeollanam-do_Housing Supply Rate Status
Open API Information Download metadata Provides schema.org based metadata.
| Service | Haenam-gun, Jeollanam-do_Housing supply rate_20221027 | ||
|---|---|---|---|
| Classification System | Social Welfare - Housing | Provider | |
| Management Agency | Public Data Utilization Support Center | Management agency phone number | 1566-0025 |
| Basis For Retention | Collection Method | ||
| Update Cycle | Occasional (one-time data) | Next Enrollment Date | |
| Media Type | Text | Whole Row | 14 |
| Extension | XML, JSON | Application For Use | 1 |
| Data Limit | Keyword | Housing supply rate,Housing status,house,society,apartment,multi-family | |
| Enrollment | 2022-10-27 | Correction | 2025-08-14 |
| Form Of Provision | Download from open data Portal (the original text file registration) | ||
| Explanation | This is the housing supply rate status data for Haenam-gun, Jeollanam-do. This data consists of 9 types: year, number of households, total, single-family homes, multi-family homes, apartments, townhouses, multi-family homes, and supply rate. It shows the numerical changes in the number of households and residential homes over 14 years from 2009 to 2022. - The number of single-family homes, multi-family homes, apartments, and townhouses has steadily increased. - Multi-family homes have increased until 2017 and then decreased. - The supply rate has gradually increased and is maintained at over 110% as of 2018. - Vacant houses, which are one of the biggest problems in rural areas, are included in the figures. | ||
| Other Notes | |||
| Payment | free | Charge Standard And Unit | Case |
| Scope Of Use | The use permission range limitless | ||
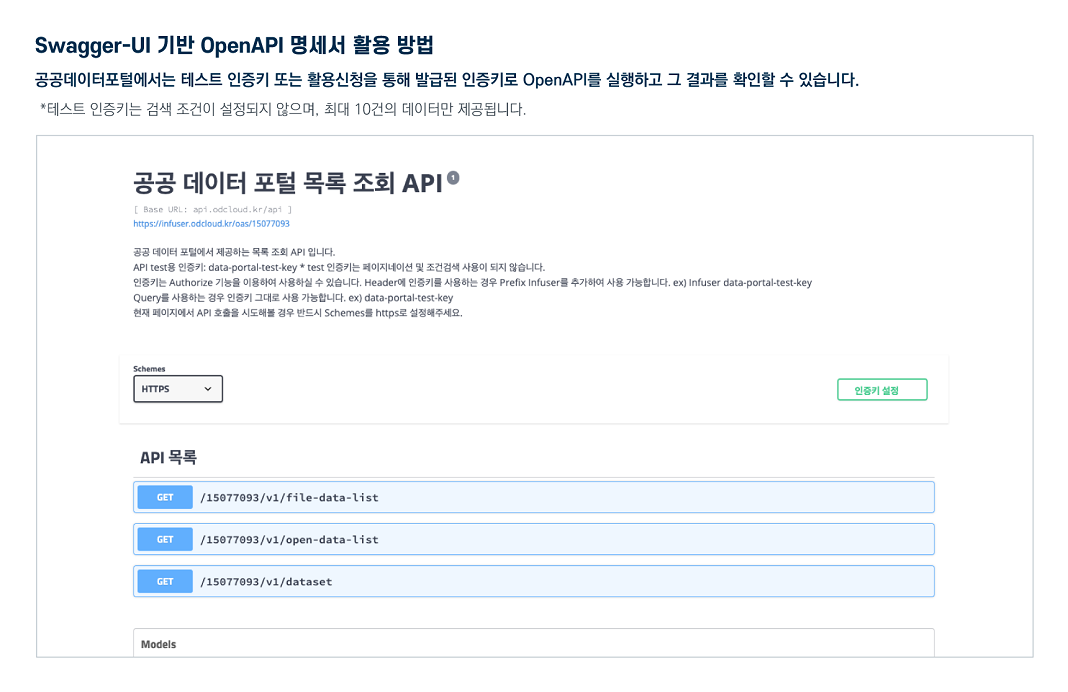
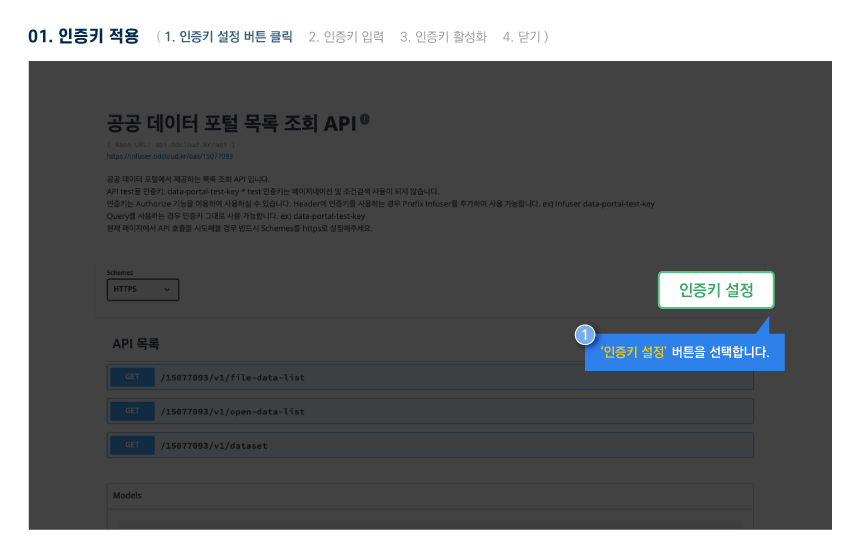
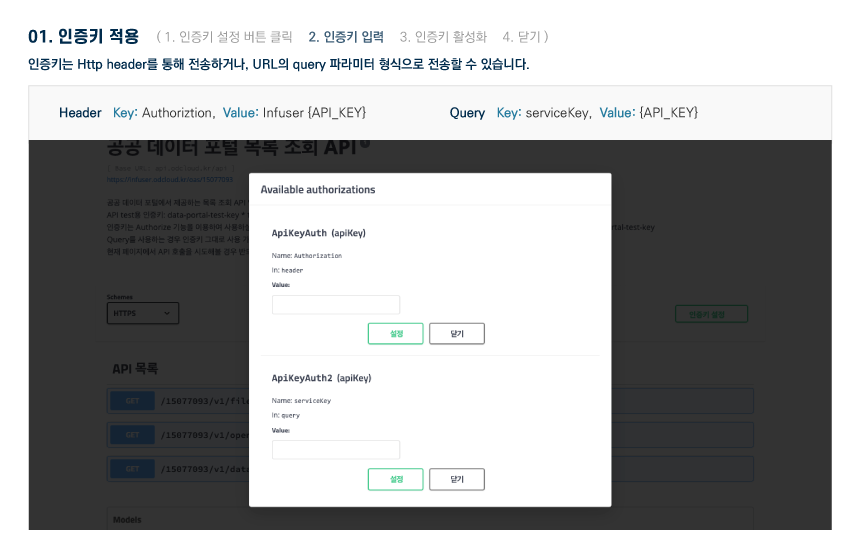
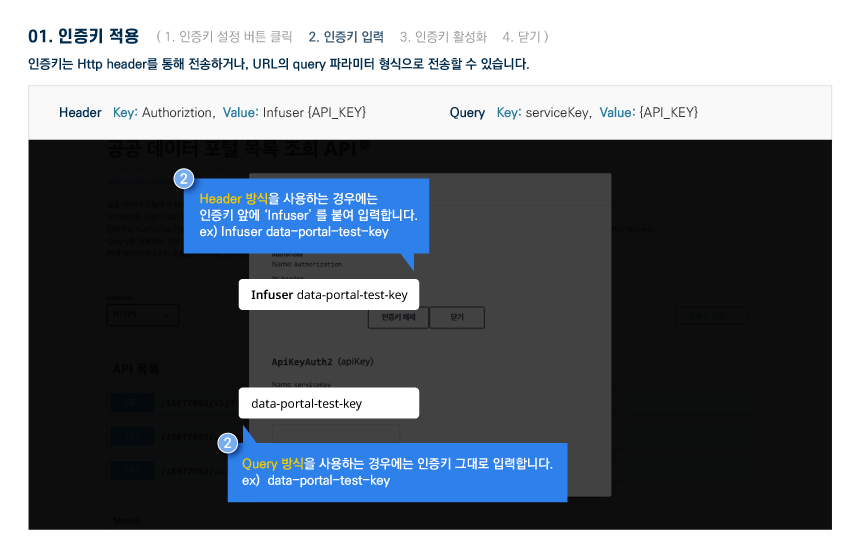
Usage Specification